Make Elasticsearch Query Profiling Faster in Kibana
TL;DR
curl "http://localhost:9200/index-with-many-shards/_search" -H 'Content-Type: application/json' -d'{"profile": true}' | jq ' .profile.shards = [.profile.shards[0]]' | pbcopy
and paste into the Kibana’s Search Profile panel.
Problem
When you profile a complex Elasticsearch query that targets many shards then Kibana might need a very long time (think, minutes) to visualize the profiling data. It might be due to some bug in the Kibana or maybe you just throw too much data in there and since Javascript is single threaded it just takes time. Anyway, you want to see the profile data visualization because reading the raw JSON is not your thing.
Solution
A trick you can try is to visualize only a part of the profile data. What part? Let’s say the profile data from only one shard.
The Elasticsearch response with the profile data has this shape:
{
  "took": 3,
  "timed_out": false,
  "_shards": {
    "total": 66,
    "successful": 66,
    "skipped": 0,
    "failed": 0
  },
  "hits": {
    "total": {
      "value": 10000,
      "relation": "gte"
    },
    "max_score": null,
    "hits": []
  },
  "profile": {
    "shards": [
    ]
  }
}
And the important bits are under .profile.shards array (jq syntax).
Let’s create a little jq script that would transform the response body to include the profile data from only one shard:
jq '.profile.shards = [.profile.shards[0]]'
The output is now much smaller.
For this script to work its input must be the full body of the Elasticsearch response in JSON.
Luckily for us, a simple curl (that can be copied directly from Kibana Dev Tools) does the job well, e.g.:
curl "http://localhost:9200/index-with-many-shards/_search" -H 'Content-Type: application/json' -d'{"profile": true}'
Pipe the output of that curl command to the jq script:
curl "http://localhost:9200/index-with-many-shards/_search" -H 'Content-Type: application/json' -d'{"profile": true}' | jq '.profile.shards = [.profile.shards[0]]'
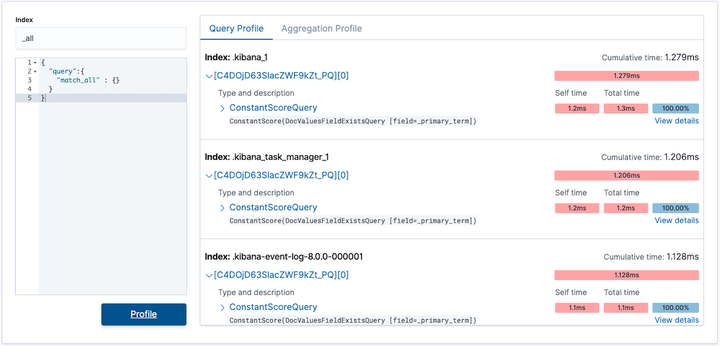
Now just select the output with you mouse, copy, and then paste it in Kibana’s Search Profile panel and investigate the query profile.
But using the mouse in terminal is not sleek
One aditional trick to make the process sleeker is to send the profile data to the clipboard directly from your terminal and then paste in Kibana. This can be done by simply piping the output to your clipboard. Unfortunately, the script is different for different operating systems.
Example in macOS:
curl "http://localhost:9200/index-with-many-shards/_search" -H 'Content-Type: application/json' -d'{"profile": true}' | jq '.profile.shards = [.profile.shards[0]]' | pbcopy
Example in Kubuntu 21.04:
curl "http://localhost:9200/index-with-many-shards/_search" -H 'Content-Type: application/json' -d'{"profile": true}' | jq '.profile.shards = [.profile.shards[0]]' | xclip -selection clip